The Short Answer
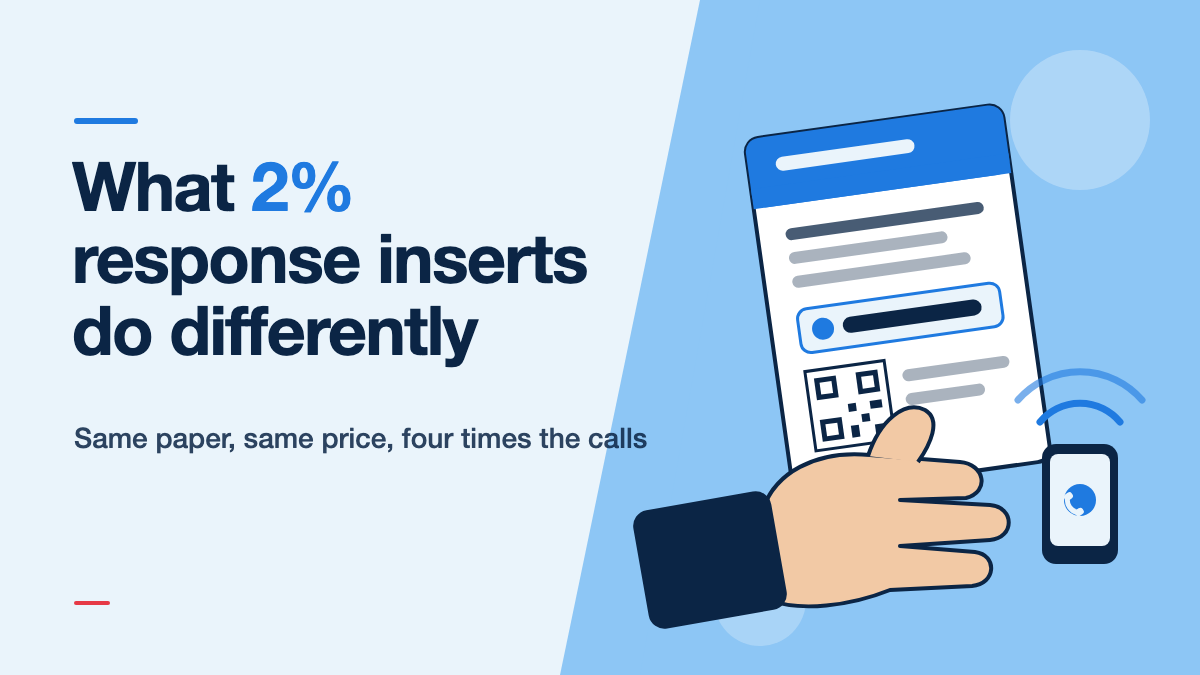
Inserts that reach about 2% response are rarely bigger or glossier than the ones stuck at 0.5%. What sets them apart: they reach households that already buy nearby, lead with one offer that ends soon, give one easy way to respond, have someone answering on drop weekend, and count every response. Each decision multiplies the others.
Key Takeaways
- Across the 500+ insertion campaigns we have executed in 30+ Indian cities since 2020, direct response to inserts with a clear call to action typically falls between 0.5% and 2% of copies inserted. This post is about what separates the two ends of that band.
- On a 50,000-copy A5 drop at ₹1.20 per copy (₹60,000 plus GST), 0.5% is 250 responses at ₹240 each, and 2% is 1,000 responses at ₹60 each. Same paper, same cost, four times the result.
- The top-band campaigns we see share six traits: a catchment built from where customers already come from, one offer with an end date, one response path, staffed phones on drop weekend, a drop date chosen for the reader, and a count that includes walk-ins and missed calls.
- What they usually do not have is a larger budget, a heavier paper or more copy on the sheet.
- 2% is a realistic target for small, local, time-bound purchases. For flats, jewellery and other high-ticket buys, the lower half of the band is normal and the right metric is cost per qualified lead.
Two businesses can book the same 50,000 copies, in the same newspaper, at the same rate, and one gets four times the calls of the other. The paper is not the difference. This post walks through the decisions where the two campaigns part ways.
Why are we not publishing one client's campaign?
Because one campaign proves very little, and client figures are not ours to publish. A single 2% result can come from a lucky weekend, a competitor closing down, or a festival nobody planned around. What is useful is the pattern: the things that show up again and again in the campaigns that land at the top of the band, and are missing from the ones at the bottom.
What follows is that pattern, drawn from campaigns where clients shared their response numbers back with us, measured through dedicated phone numbers, QR scans, WhatsApp messages and coupon redemptions. Where we give arithmetic, it uses our published rates and is labelled as a worked example, not as a client result.
What does a 2% response rate actually mean?
It means 2 responses for every 100 copies inserted. On 50,000 copies, that is 1,000 people who called, scanned, messaged or walked in with the insert.
Two details decide whether that figure is honest:
- The denominator is copies inserted, not copies printed. Your distribution certificate and area-wise delivery report give you the inserted count. Spare copies left at the printer do not belong in the maths.
- The numerator is every response you can trace to the insert. Calls to the dedicated number, missed calls, QR scans that reached the landing page, WhatsApp messages to the number printed on the sheet, and walk-ins who showed the insert or quoted its code.
Here is what the band means in money, using our published rates. All three sizes include printing, insertion and transport; GST is extra and the minimum order is 50,000 copies.
| 50,000 copies | Campaign cost | At 0.5% | At 1% | At 2% |
|---|---|---|---|---|
| A5 at ₹1.20 | ₹60,000 | 250 responses, ₹240 each | 500, ₹120 each | 1,000, ₹60 each |
| A4 at ₹1.50 | ₹75,000 | 250, ₹300 each | 500, ₹150 each | 1,000, ₹75 each |
| A2 at ₹2.00 | ₹1,00,000 | 250, ₹400 each | 500, ₹200 each | 1,000, ₹100 each |
Illustrative arithmetic on published all-inclusive rates, GST extra. Not a client result. Current city-wise rates are on our pricing page.
The spend is fixed the moment you book. Everything below is about moving along that row. Current rates by city are on our pricing page.
Did the top-band campaigns reach different households?
Almost always, yes, and this is the decision that matters most, because it happens before a single word is written.
The campaigns at the bottom of the band usually chose an edition by brand and a city by habit. The ones at the top built the catchment from their own data: the pin codes their existing customers, students or patients already come from, and the localities within easy reach of the shop, clinic or site. To take a hypothetical example, a clinic whose patients come from four neighbourhoods does better inserting 50,000 copies into those four than 100,000 copies across the city.
Newspaper insertion lets you do this because vendors deliver by round, and rounds map onto localities. Our guide to pin-code targeting with newspaper inserts explains how the mapping works, and how newspaper distribution works in Indian cities covers the vendor side. Language follows the catchment: in many areas a vernacular daily reaches the households you want better than a larger English title.
What did the offer look like?
One offer, stated in the headline, with an end date.
In the top-band inserts we see, the reader can tell in three seconds what is on offer and why it matters this week: admissions closing on a date, a health camp on Sunday, a flat 20% off until the month end, free delivery on the first order this weekend. The bottom-band inserts read like brochures: a logo, a list of services, “contact us for details”.
The deadline does more work than the discount. A modest offer with a real end date usually outperforms a generous offer with no date, because the date turns “I should look into that” into “I should do it by Saturday”. Our post on common insertion mistakes covers the no-offer brochure in detail; the point here is that the top-band campaigns we see have consistently solved it.
How did people respond, and did anyone answer?
Top-band inserts give one primary way to respond and make it large: a phone number or WhatsApp number big enough to read across a table, with a QR code beside it for those who prefer to scan. Where the audience is not smartphone-first, a missed-call number is often the easiest response of all.
The part most advertisers overlook is what happens next. A strong insert concentrates its response into the first few days after the drop. If the number rings through to a busy reception desk, or the WhatsApp messages wait until Monday, a large share of that 2% is lost before it becomes a lead. The campaigns that land at the top of the band usually staff the phones for the drop weekend, brief the team on the offer and its code, and reply to every message the same day.
Did the drop date matter?
Yes. The top-band campaigns chose the day for the reader, not for the printer’s schedule.
Weekends are the default for most categories, because the paper gets read slowly and the family discusses what is inside it. Our analysis of the best days for newspaper insertions sets out the pattern. Beyond the weekday, the best campaigns line the drop up with the reader’s own calendar: before an admission deadline, a festival shopping week, or the weekend of a store opening. Allow about 7 to 8 working days from approved artwork to doorstep so the date is not left to chance.
Did they print more, or on better paper?
Usually not, and this is the most useful finding for anyone with a fixed budget.
Format should match the job. A restaurant menu or a sale announcement does well on A5 inserts at ₹1.20 per copy; a property launch that needs a floor plan earns its place on A2 inserts at ₹2.00; photography-led retail suits A4 glossy inserts at ₹1.50. We see top-band results on all three sizes and bottom-band results on all three. The format decides what the insert can show; it does not decide whether the offer is worth acting on.
The same goes for volume. Doubling copies into the wrong catchment doubles the cost and leaves the response rate where it was. A second drop into the right catchment two or three weeks later, with the same offer and a fresh deadline, usually does more than a bigger first drop.
Did they count differently?
Often the difference between a “1% campaign” and a “2% campaign” is partly in the counting.
A business that counts only QR scans will under-report, because many readers call or walk in instead. The top-band campaigns we see give the insert its own phone number, its own QR source tag and a short code the counter staff ask about (“did you see our paper insert?”). Our guide to tracking insert response with QR codes covers the set-up. They also keep the distribution certificate and area-wise report, so when one locality under-performs they can tell a delivery problem from a message problem.
Is 2% a realistic target for your category?
It depends on what you sell.
- Closer to the top of the band: small, local, time-bound purchases. Food offers, retail sales, admissions with a deadline, dated health camps and service businesses with a first-visit offer.
- Lower in the band, and that is fine: high-ticket, considered purchases. Flats, jewellery, cars and premium education. A household does not buy a flat because of one Sunday insert. For these, judge the campaign on cost per qualified enquiry or site visit, not on the response percentage, as our guide to planning a real estate insert campaign explains.
How does your plan compare before you book?
| Decision | Bottom of the band | Top of the band |
|---|---|---|
| Catchment | Whole city, chosen by habit | Pin codes your customers already come from |
| Newspaper | Largest brand | The edition these households read, in their language |
| Headline | Company name and services | One offer, one reason to act this week |
| Deadline | None | A real date on the sheet |
| Response path | Several small numbers and an email | One large number or QR, plus WhatsApp or missed call |
| Drop weekend | Phones unattended | Team briefed, messages answered same day |
| Tracking | QR scans only | Own number, QR tag, counter code, delivery report |
| Follow-up | One drop | A second drop into the best-responding areas |
If your plan sits mostly in the right-hand column, you have done what the top-band campaigns do. Response still depends on your category, your price and your competition, and no one can promise a rate in advance.
The paper and the price are fixed the day you book. The response rate is decided by who gets the insert, what it asks them to do, and whether anyone answers.
Aiming for the top of the band?
Get a free quote. We respond within two hours with newspaper options, area-wise reach estimates and pricing for your city and format.
Get Free Quote